Author: Marie Poteriaieva, CoinTelegraph; Translated by Wuzhe, Jinse Finance
On February 3, Bit dropped below $92,000, shocking the cryptocurrency market and triggering $2.1 billion in liquidations. Initially, investors seemed prepared for the economic difficulties caused by US President Donald Trump's announcement of a tariff war. However, concerns soon shifted to whether Bit had already peaked and was about to enter a downward trend.
More worryingly, Bit Archive pointed out that every Bit bull market in the past reached its peak within 330 days after breaking the previous cycle's all-time high. February 4 was the 328th day.
However, Bit rebounded quickly after the drop. The announcement on February 3 to suspend tariffs on Mexico and Canada, as well as an upcoming speech by Trump's crypto czar David Sacks on February 4, seemed to reassure the market.
This raises the question: Has the market rebounded too quickly? Macroeconomic and geopolitical challenges remain, posing the risk of Bit traders falling into a bull trap.
Strong Bit Demand
As the tariff war panic has shown, Bit demand remains strong, continuing to absorb the pullback - even at historical highs above $90,000.
Glassnode's analysis of the Bit bull market correction indicates that demand for BTC may rise, potentially triggering a "second leg up" in the market. Historical data shows that in the past three cycles (2011-2015, 2015-2018, and 2018-2022), the average correction was around 25%, followed by an acceleration in price performance in the final third of the bull market. The current bull market has not yet experienced such an acceleration.
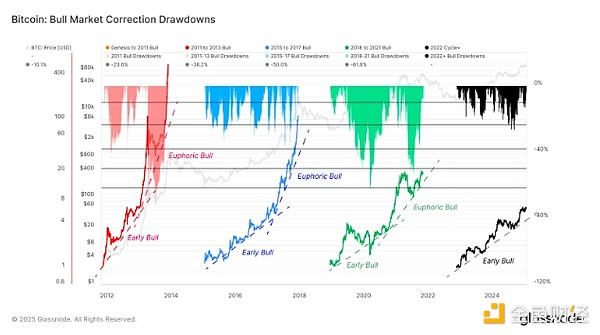
Bit bull market corrections. Source: Glassnode
On the supply side, a key metric to watch is the long-term/short-term holder threshold. It tracks the capital rotation from long-term investors to new buyers, providing a clearer understanding of supply dynamics.
Bit cycle peaks typically coincide with long-term holders realizing profits and selling their tokens to new buyers. Glassnode data shows that this is not currently the case. Although long-term holders have transferred over 1 million BTC to new buyers since November, they still hold a significant share of the supply, indicating their confidence in future price appreciation.
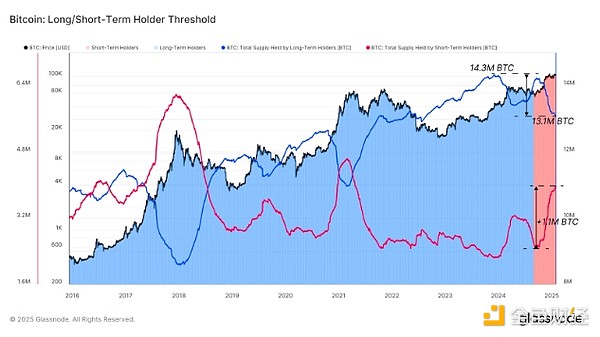
Bit long-term and short-term holder thresholds. Source: Glassnode
How High Can Bit Reach by 2025?
Glassnode's other data shows that so far, the 2022-2025 cycle is very similar to the 2015-2018 cycle. However, a complete repeat is unlikely. In 2017, Bit's all-time high caused its price to grow 113-fold, while the next peak brought a 20-fold return. As Bit matures, the growth rate in each cycle is declining, requiring increasingly more capital inflow to sustain new price levels.
So far, BTC has risen 6-fold from the cycle low of $16,000 in December 2023, suggesting an expected multiplier in the range of 10x to 13x. This implies a peak in the range of $160,000 to $210,000 - a target range consistent with many analysts' forecasts. VanEck's Digital Asset Research Head Matthew Sigel expects Bit to reach $180,000, while Bitwise Asset Management and Bernstein forecast Bit to reach $200,000. CNBC contributor and Fundstrat Managing Partner Tom Lee predicts Bit to reach $250,000.
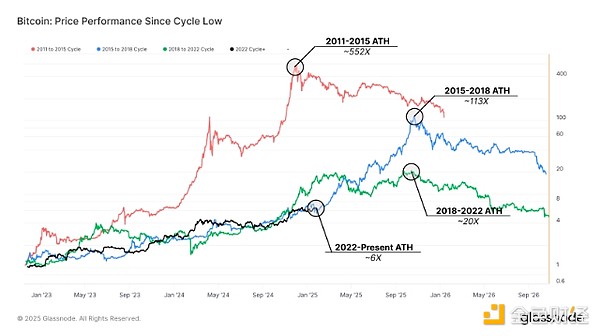
Bit price performance since the cycle low. Source: Glassnode
When Will Bit Peak?
Technical analyst CryptoCon believes the Relative Strength Index (RSI) is quite accurate in determining cycle stages. RSI is a momentum oscillator that measures the speed and magnitude of price changes, helping to identify overbought and oversold conditions of an asset.
By analyzing instances where the RSI approached the 99% threshold, CryptoCon identified key cycle stages. Their data shows that Bit entered the fourth cycle stage last November, indicating that the market may peak around September to October 2025.
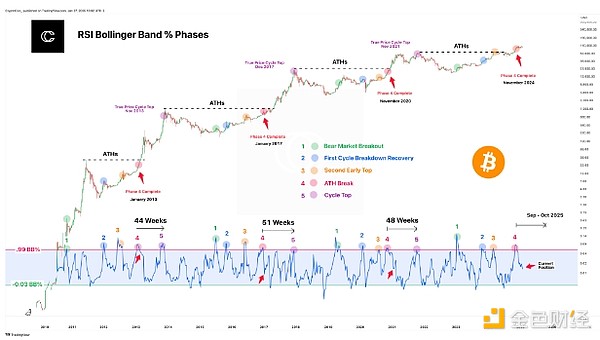 RSI Bollinger Band % Stages. Source: CryptoCon_/X
Another historically accurate indicator for identifying market tops is the Pi Cycle Top. This metric tracks the multiple (350DMA x 2) of the 111-day moving average (111DMA). In previous cycles, Bit's price reached a peak when 111DMA crossed above 350DMA x 2.
Based on the Bit Pi Cycle Top prediction, this projection estimates the next peak will occur around September 26.
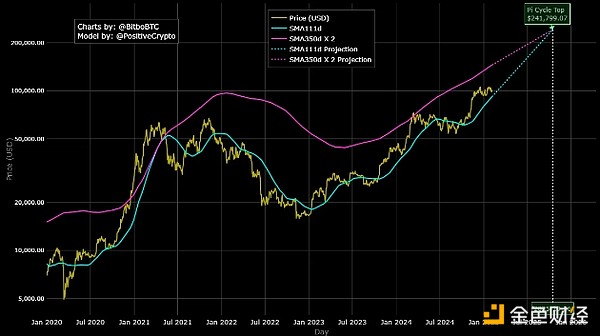
Bit Pi Cycle Top Prediction. Source: Bitbo, PositiveCrypto
While no indicator is perfect, the market's resilience and sustained demand suggest the true top may still lie ahead.


